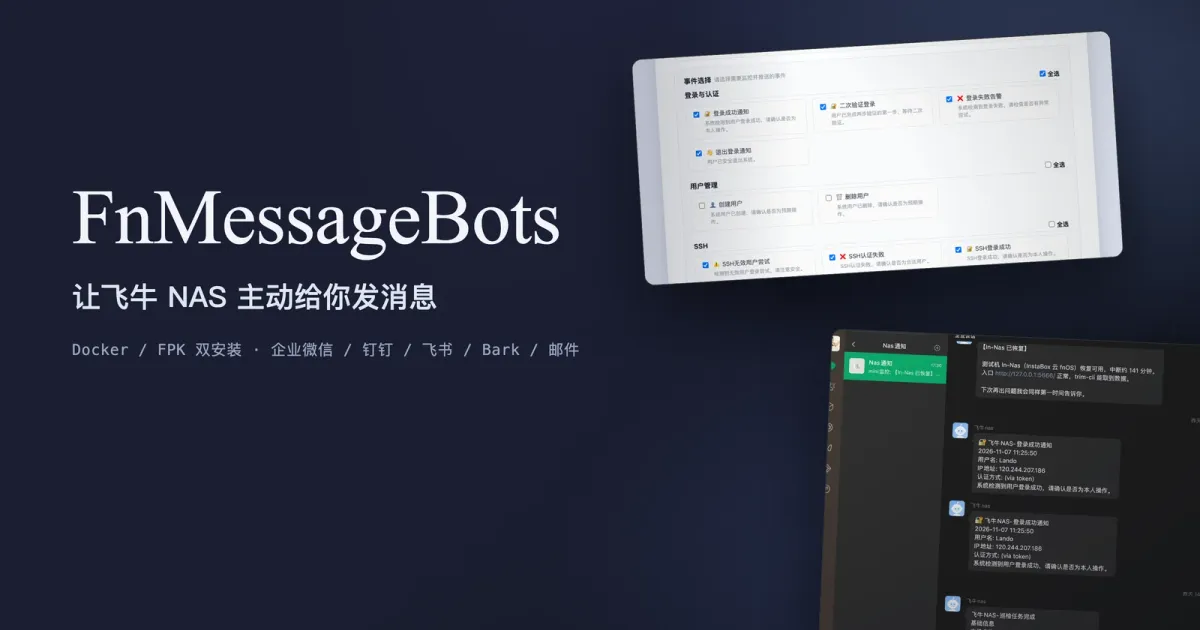
fnOS doesn’t have an event bus. It has one SQLite log database. If you want “who logged in, which disk just spun up, which container died” to become a message on your phone, you have to build the pipe yourself.
One Python process, 57 modules, about 23,170 lines. 28 test files, 365 cases. 70k+ downloads across App Center and Docker, roughly a thousand people running it steadily.
This page takes it apart: where the data comes from, how it becomes a message, what happens when delivery fails, and the bugs on the way.
The short version: runtime and code size
| Item | Value |
|---|---|
| Runtime | Python ≥ 3.9 (official image is python:3.11-slim) |
| Platforms | fnOS (os_min_version = 1.1.3100) and any Docker host (amd64 / arm64) |
| Code | 57 .py files under src/, about 23,170 lines |
| Tests | 28 test files, 365 cases (123 of them subtests) |
| Dependencies | Everyday packages: requests, psutil, Flask; the FPK builds a venv on the NAS |
| State | data/cursor/ (cursors, outbox), data/logs/ (rotated daily, kept 7 days), config/config.json |
src/├── main.py # 装配、信号、热加载、批汇总刷盘线程├── monitor/│ ├── db_log_poller.py # 主日志库轮询(游标 = 自增 id)│ ├── ssh_journal_poller.py # journalctl 采 SSH(新版主库没有 Sshd 记录)│ ├── docker_events_poller.py # docker unix socket 事件流│ ├── media_db_poller.py / music_db_poller.py / photo_db_poller.py│ ├── scheduler_db_poller.py / backup_db_poller.py / trim_activity_poller.py│ ├── event_processor.py # 事件 → 汇总、合并窗口、处理函数注册表│ ├── batch_dedupe.py # 批内指纹去重(按源定制)│ └── nas_patrol.py / wan_ip_monitor.py├── notifier/ # 10 个渠道 + 统一分发 + 300 秒去重├── web/ # Flask 配置页、鉴权、数据源只读自检└── utils/notification_outbox.py # 落盘待发队列(SQLite)Four constraints shaped the whole design
| Constraint | What it forced |
|---|---|
| One SQLite database, no push API | Polling only; the cursor has to be the autoincrement id, never a timestamp |
| Nobody gives a log bot root | Runs as the FnMessageBot app account by default; unreadable sources are handled with ACL instructions, not privilege escalation |
| Installed on small boxes like an i3-8100T with 15G | One process, many threads, no Redis or MQ; all state is files |
| A notification tool that gets noisy gets uninstalled | Dedupe, merging, quiet hours and digests aren’t features, they’re survival requirements |
Startup order and the threading model
The sequence in Application.initialize() is deliberate:
self.config = Config()                    # env 覆盖 + config.json
init_push_stats(self.config.cursor_dir)   # 推送统计(Web 页上的数字)
has_webhook = any(10 个渠道参数)           # 没配渠道 → 只起 Web 配置页
self.notifier = UnifiedNotifier(config)
self.event_processor = EventProcessor(notifier, config)
self.log_poller = self._build_log_poller()
self._sync_optional_pollers()             # 按勾选起 0~8 个数据源线程
self._register_db_event_handlers()        # eventId → handler 映射
# 再 start() 各 poller、起 UnifiedPollBatchFlush 线程、巡检线程、Flask
Two of those lines are intentional ordering. No channel configured means no polling — otherwise someone installs it, hasn’t set up WeCom yet, and the process is already reading the database and computing dedupe keys for nothing. And optional sources start on demand: eight sources, each with its own poll loop and cursor, and if you didn’t tick them, zero threads.
There’s no shared mutable center between threads. Each poller writes only its own cursor, and events travel downward as immutable dicts.
| Thread | Job | Period |
|---|---|---|
DBLogPoller | The main log database | 5 seconds |
| The optional pollers | docker / media / music / photos / scheduler / backup / trim-activity / SSH | each its own switch |
UnifiedPollBatchFlush | Flushes the accumulated poll batch | event-driven |
nas_patrol | CPU / temperature / SMART / capacity | your cron setting |
wan_ip_monitor | Public IP changes | 600 seconds |
Ingestion: why the cursor is an id, not a timestamp
def _run_loop(self):
    last_id = None
    while self.running:
        if last_id is None:                       # 首次启动
            last_id = self._get_max_log_id()      # SELECT COALESCE(MAX(id),0) FROM log
            self._write_last_id(last_id)          # data/cursor/db_poller_cursor.txt
        last_id = self._poll_once(last_id)
That first read of MAX(id) has to succeed. If it fails, the loop retries — it never guesses a starting cursor. Guess low and you replay history into the phone; guess high and you never see another event.
There’s one query, and id ASC gives you ordering that matches occurrence:
SELECT id, serviceId, uid, uname, logtime, loglevel, eventId, parameter, category
FROM log WHERE id > ? ORDER BY id ASC
The reason it’s id and not logtime is that logtime is skewed on older fnOS builds — which is exactly why LOGTIME_DISPLAY_OFFSET_SECONDS exists later on. Use a timestamp as a cursor and the first DST or timezone change either drops events or replays them.
Connections always go through connect_readonly_with_fallback(), opened read-only, because this is somebody else’s database. My process must not hold a write lock and stall fnOS’s own logging service.
Every row goes through four steps, and the order matters: map eventId to an internal type → apply special cases (SshdLoginAuthFail with uname=invalid splits into SSH_INVALID_USER, because fnOS crammed two meanings into one eventId) → filter (the ticked event list, the SSH source allow/deny lists) → _parse_parameter() to parse the JSON and add three provenance fields, _source, _source_cursor, _source_event_id. Without those three fields, every dedupe downstream stops working.
Aggregation: one message per poll
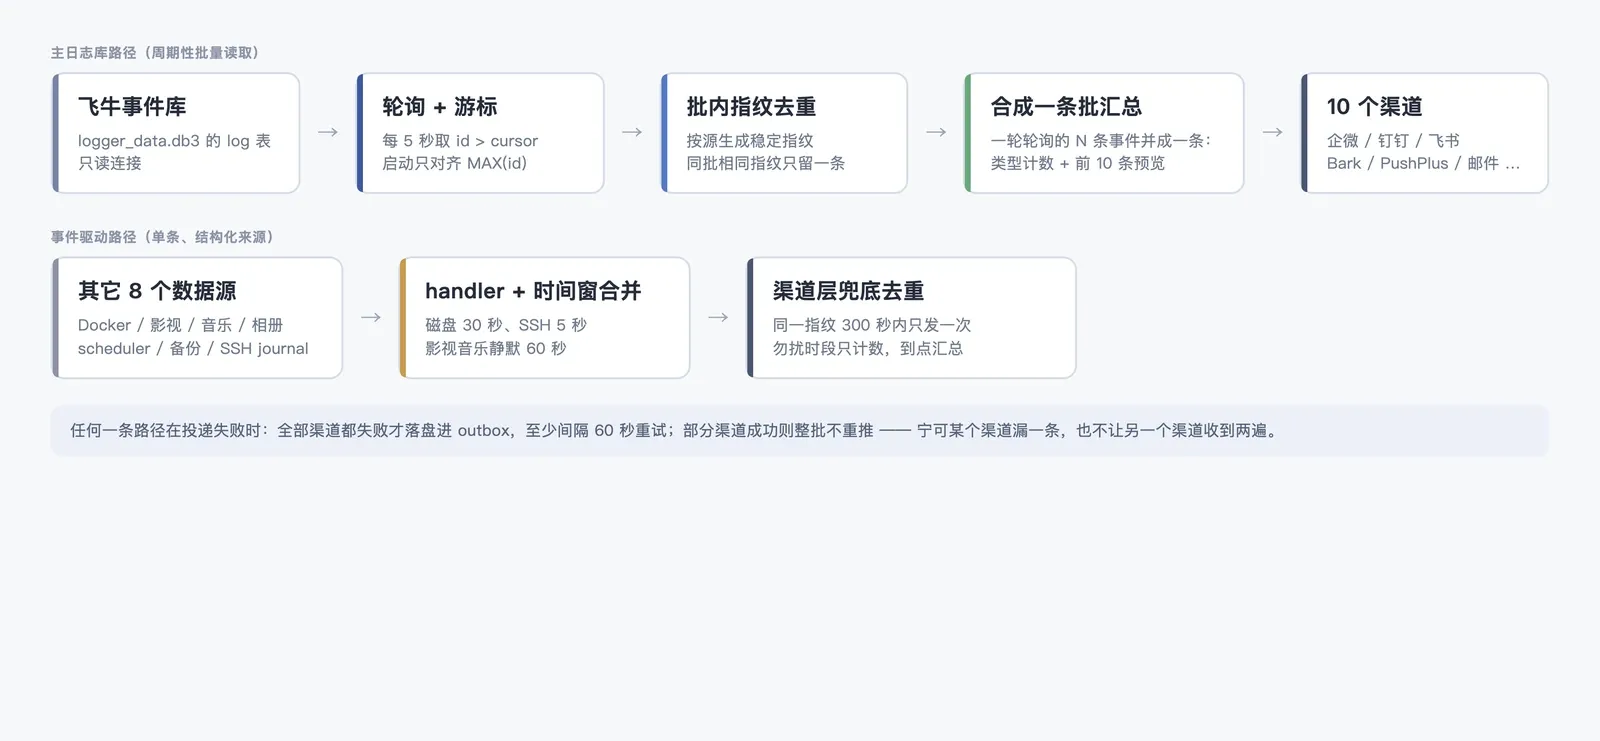
This is the most important decision in the project. N events read in one poll do not become N messages. They become one POLL_BATCH_SUMMARY:
batch_events = dedupe_poll_batch_items(batch_events)      # 批内指纹去重
summary_event_data = {
  "count": len(batch_events),
  "by_type": {"SSH_AUTH_FAILED": 1, ...},                 # 按类型计数
  "items": preview_items[:10],                            # 前 10 条摘要
  "grouped_events": grouped_events,                       # 勿扰汇总要用
  "_source_key": md5(拼接 source:cursor),                 # 渠道层去重用
}
self.notifier.send_notification(event_type="POLL_BATCH_SUMMARY", ...)
Why: a WeCom group bot caps out at 20 messages a minute. Power coming back after an outage, a bulk library import, an SSH brute-force run — any of those can produce dozens of events inside one poll. Sending them one by one doesn’t buy you timeliness. It gets you silently dropped by the rate limiter, and the one dropped is the one that mattered.
The raw rows still get written to local storage one at a time (_store_notification_log), so folding loses nothing: the message is the summary, the database has the history.
Three layers of dedupe, each blocking a different repeat
Dedupe isn’t “a window”. It’s three layers, each solving duplicates from a different source:
| Layer | Implementation | What it blocks |
|---|---|---|
| L1, per-batch fingerprint | batch_dedupe.fingerprint_poll_batch_item() | Duplicates from two threads enqueuing, or from a flush race |
| L2, time-window merging | 30s for disks / 5s for SSH / 60s of silence for media and music | The same thing firing repeatedly (disk wake loops, brute force, bulk imports) |
| L3, channel-level 300s | _is_duplicate() | The catch-all for repeats across polls and across sources |
L1 fingerprints are per-source. The Docker one has to include nanoseconds:
if source == "docker":
    # cid + action + timeNano;漏掉纳秒会把同容器短时间两次同类事件误合并
    return f"docker:{event_type}:{cid}:{action}:{engine_time_nano}"
row_id = item.get("row_id")
return f"{source}:{event_type}:row:{row_id}"
L3 is a dict with a lock and a timestamp:
def _is_duplicate(self, fingerprint: str) -> bool:
    with self._dedup_lock:
        if fingerprint in self.sent_events:
            if time.time() - self.sent_events[fingerprint] < self.dedup_window:  # 300
                return True
            del self.sent_events[fingerprint]
    return False
Failure semantics: advance the cursor only after delivery succeeds
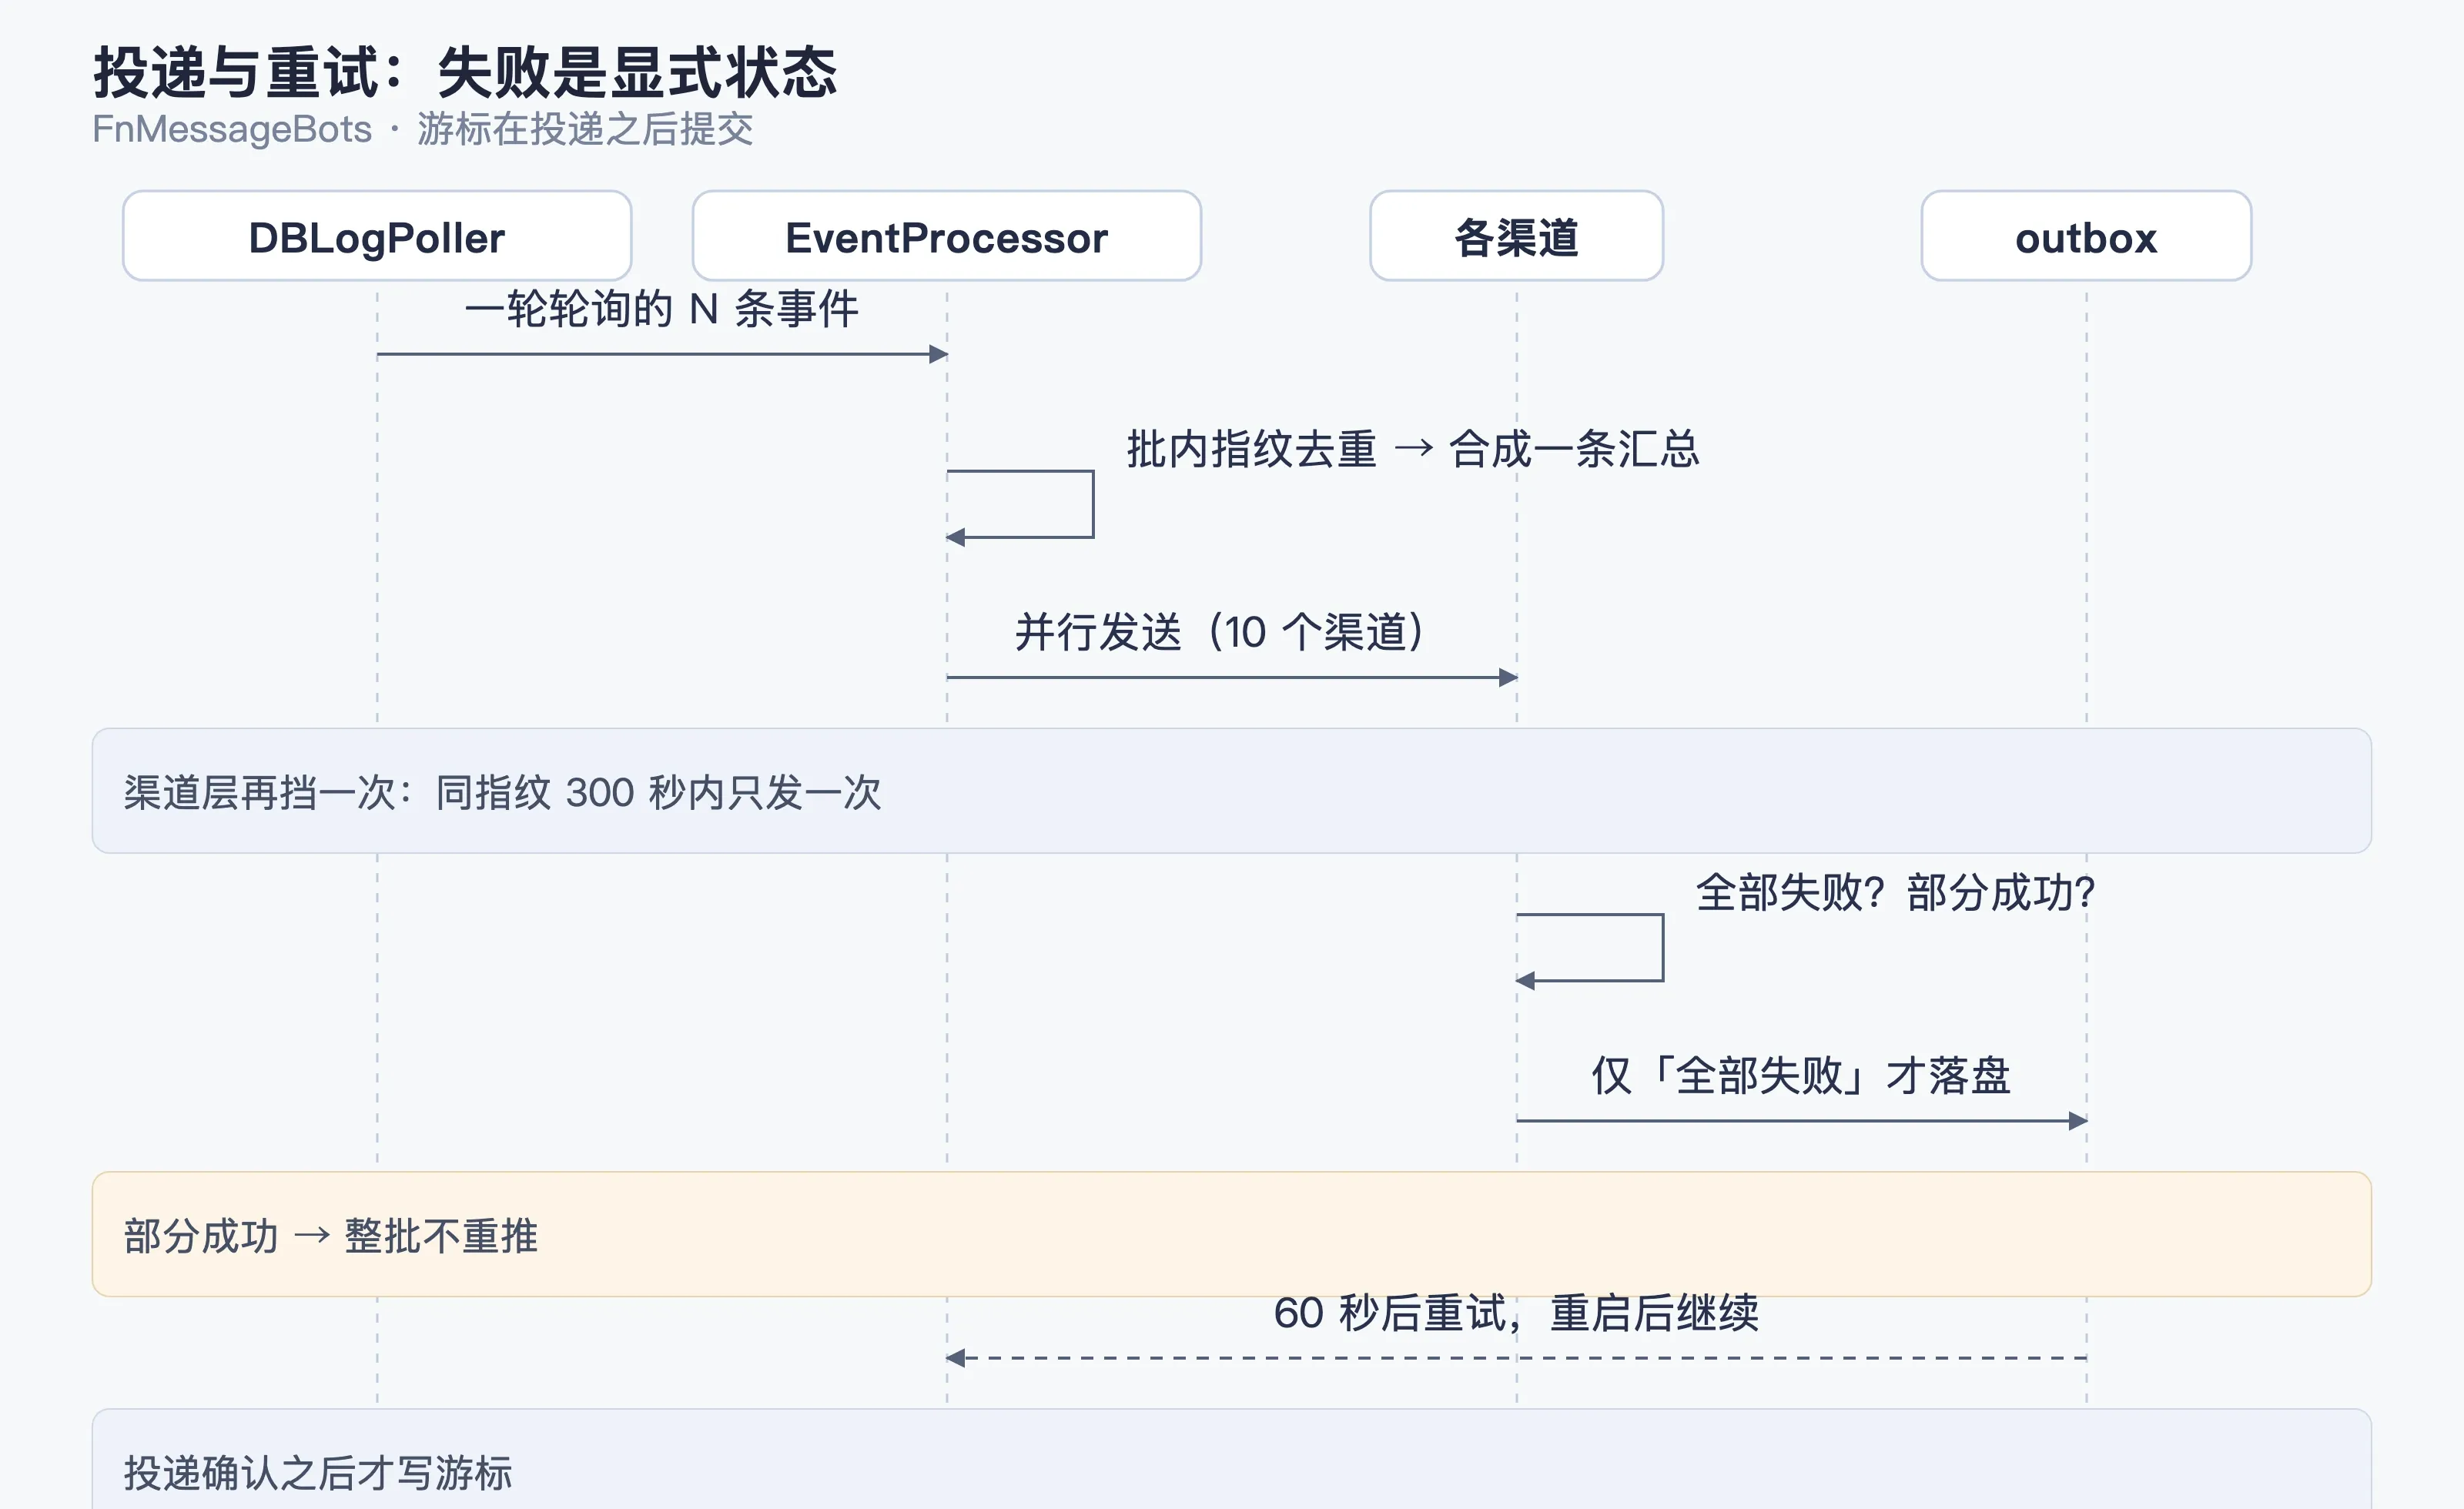
Three failure scenarios, three sets of semantics, all in the last few lines of _poll_once:
if self.batch_handler and batch_events and batch_delivery_failed:
    self._batch_fail_count += 1
    if persistence_failed or self._batch_fail_count < self.BATCH_MAX_ATTEMPTS:
        return last_id          # 不推进游标 → 下一轮重来
    self.logger.warning("批量处理连续失败 %s 次,放弃本批", self._batch_fail_count)
self._write_last_id(rows[-1]["id"]) # 只有走到这儿才提交游标OutboxWriteError— couldn’t even write the queue — never advances the cursor. Re-reading next round beats letting an event disappear.- An ordinary exception gets
BATCH_MAX_ATTEMPTSretries, then the batch is abandoned and the cursor moves on. One poison event shouldn’t wedge the whole pipe. - Every channel failing → into the outbox, retried after
RETRY_SECONDS = 60. Only some channels failing → the batch is not resent. A duplicate message is likelier to get you uninstalled than a missed one.
The outbox isn’t an in-memory list, it’s a real queue:
self.path = directory / "notification_outbox.db"        # chmod 0600
CREATE TABLE state       (name TEXT PRIMARY KEY, payload TEXT NOT NULL)
CREATE TABLE poll_events (id   TEXT PRIMARY KEY, payload TEXT NOT NULL)
PRAGMA synchronous=FULL
BEGIN IMMEDIATE
Quiet hours don’t lose events either: counts go into the state table and get composed into one message at the end. The call also returns success=True, otherwise upstream thinks it failed and retries the thing it deliberately didn’t send. Fingerprint receipts are kept for 7 days so the morning digest doesn’t double-count.
Bugs I actually hit
None of these are invented. Each one maps to a fix commit in the repo.
| Symptom | Root cause | Fix |
|---|---|---|
| Quiet hours off by 8 hours, silent by day, notifying at night | Containers default to TZ=UTC, quiet hours compare in local time | TZ=Asia/Shanghai in the Dockerfile and compose, plus LOGTIME_DISPLAY_OFFSET_SECONDS for skewed times in old databases |
| Scrolling halfway in the fnOS App Center (an iframe) gives a blank page | An extra scroll container around the event list; nested scrolling inside an iframe trips a repaint bug | Drop the inner scroll and let the iframe scroll |
| Mobile browser bounces back to the password page after login | Mobile session cookie policy differences meant the session wasn’t sent | Loosen session validation to accept the session wherever it’s presented, instead of relying on a single cookie attribute |
| Source self-check says fine, but no data is read | The read-only probe only ran SELECT 1; a half-corrupted database still returned success | The probe now reads real business tables and checks the contents, and hands you an ACL command when it fails |
| Events from different sources knock each other out, occasional misses | The dedupe key was just row_id, which collides across sources | Fingerprint is now source:type:row_id, isolated per source |
| Overwrite install wipes config and theme | The upgrade script wrote defaults unconditionally | Write defaults only on a fresh install; preserve config.json on an overwrite |
| Music library unreadable with an empty config | No fallback to the standard path when no path was configured | Fall back to the standard path and suggest the ACL command |
| SSH tests silently skipped in CI | Environment detection failed without systemd, so the cases were skipped | Inject a mock into the probe; tests no longer depend on the host |
Two more that aren’t bugs but are worth writing down. The container health check has to verify two things — the process is up and /healthz answers. A bare pgrep misses “process alive, service wedged”. And the health check must bypass the proxy, otherwise a 200 from the proxy masks a local backend that’s down:
if ! pgrep -f "python.*src/main.py" > /dev/null; then echo "Python进程不存在"; exit 1; fi
python - <<'PY'
from urllib.request import ProxyHandler, build_opener     # 显式禁用代理
host = {"0.0.0.0": "127.0.0.1", "::": "::1"}.get(host, host)
PY
Config and auth
There’s exactly one hand-edited source of config, config/config.json, and environment variables win:
| Variable | Purpose |
|---|---|
LOGGER_DB_PATH / LOGGER_POLL_INTERVAL | Database path / poll interval (5s by default) |
DEDUP_WINDOW | Channel-level dedupe window (300s by default) |
MONITOR_EVENTS | The ticked event list |
HTTP_TIMEOUT / HTTP_POOL_SIZE / HTTP_RETRY_COUNT | Channel HTTP parameters |
UI_PORT / UI_HOST / FNMB_WEB_PASSWORD | Config page port and initial password |
FNMB_TRUSTED_PROXIES | Only these IPs/CIDRs are trusted for X-Forwarded-For |
LOGTIME_DISPLAY_OFFSET_SECONDS | Time offset compensation for old databases |
One implementation detail: any key set from the environment is recorded in _env_set_keys, and env_skip() skips those keys when the config file is read. “Something I set in env can’t be changed in the UI” is design, not a bug.
Auth comes in three layers. On first run you set the password using a one-time init code from the startup log — otherwise anyone on the same subnet could grab it first. Only a salt and a PBKDF2-HMAC-SHA256 hash are stored (ITERATIONS = 100000). Sessions live in memory, expire after 900 seconds idle, and a password change invalidates all of them.
Two distributions
Docker: python:3.11-slim plus four system packages — procps (so the health check can pgrep), nut-client (to read UPS state), smartmontools (to read SMART), systemd (for the journalctl binary that collects SSH events). HEALTHCHECK --interval=30s --timeout=10s --retries=3 --start-period=40s, with amd64 and arm64 built separately and the digests merged.
FPK: the manifest sets platform = all and checkport = false (the wizard picks the port). install_callback does four things: copy default config only on a fresh install; write the wizard password as salt + hash only, with chmod 600; build a venv and install dependencies (some fnOS volumes don’t support symlinks, so --copies first with a fallback to pip install --target); and hand out the Docker fallback URL if any of it fails. An overwrite install keeps the existing port and password.
Tradeoffs and known limits
| Choice | Alternative | Why not |
|---|---|---|
| Poll SQLite | inotify / journalctl -f | The main database has no event stream; inotify only tells you a file was written, without the structured fields |
| One merged message per poll | Push each event in real time | Hits channel rate limits and takes the one that mattered down with the rest |
| One process, many threads | Split ingestion and delivery into two containers | One more deployable unit, and a bigger blast radius |
| Hand-rolled SQLite outbox | Celery / Redis | Asking users to run another daemon on their own box is a tax |
| Fixed 60-second retry | Exponential backoff | The value of an event notification decays; a push 5 minutes late is worse than none |
| Least privilege by default | Just run as root | It’s installed on other people’s NAS boxes. My bug shouldn’t break their system |
Known limits: 5 seconds is the floor on latency. No backfill — phone offline for two hours and you get nothing, go read the log database. Single-writer outbox — hundreds of events a day is fine, high throughput isn’t. And the event list is tied to the fnOS version: rename an eventId or change a table and it needs adapting, which is the main maintenance cost of this project.
Where to get it
日志推送in the fnOS App Center, or the.fpkfrom GitHub Releases- Docker:
sunanang/fn-message-bots:latest(amd64 / arm64) - Source (MIT): github.com/Sunanang/FNMessageBots
Install, which events to tick, how to grant permissions: FnMessageBots: get your NAS to message you first