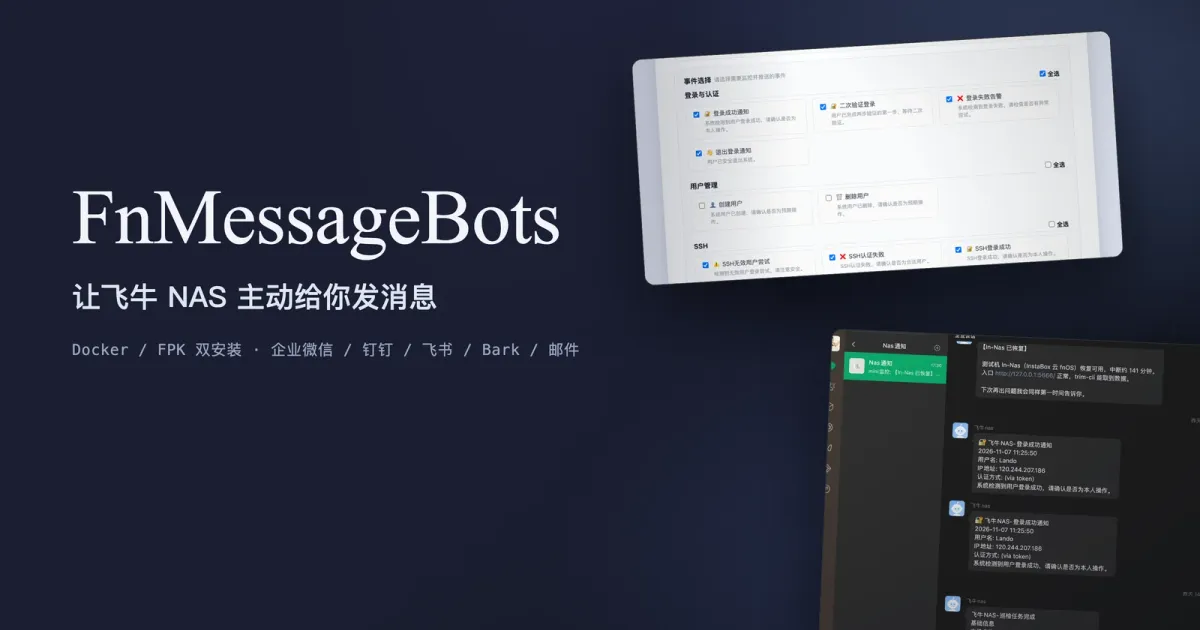

Why I built this thing
I keep a fnOS NAS at home. It’s on 24/7, runs my containers, holds the photos, backs up a few machines. After a while one detail started to bug me:
It knows everything. It just never tells me.
A disk drops out of the array. A container dies at 3am. Someone tries to SSH in from outside. The UPS switches over to battery. All of that is already in fnOS’s system log. The problem is that I have to go read it, and nobody actually reads logs every day. So by the time you notice, the answer is usually “it’s been broken for two days”, not “it just broke”.
What I wanted was pretty plain: stop making me watch the logs, let the logs come find me. My phone buzzes in WeCom (Enterprise WeChat), I glance down, and I know whether the NAS is okay.
How it grew
The core of this is boring, one sentence: fnOS writes events into a SQLite database, and I read it on a timer.
The database lives at /usr/trim/var/eventlogger_service/logger_data.db3 and the table I care about is log. No push API, no event bus, so polling is the only option — every few seconds, check for rows newer than the last one.
The first trap here is a classic: you don’t want every restart to replay all of history. On startup the program reads the current max id, writes it down as the baseline, and from then on only handles rows above it. That sounds like a footnote. It’s the difference between a quiet phone and three hundred unread push messages, the first time you restart the container after getting home.
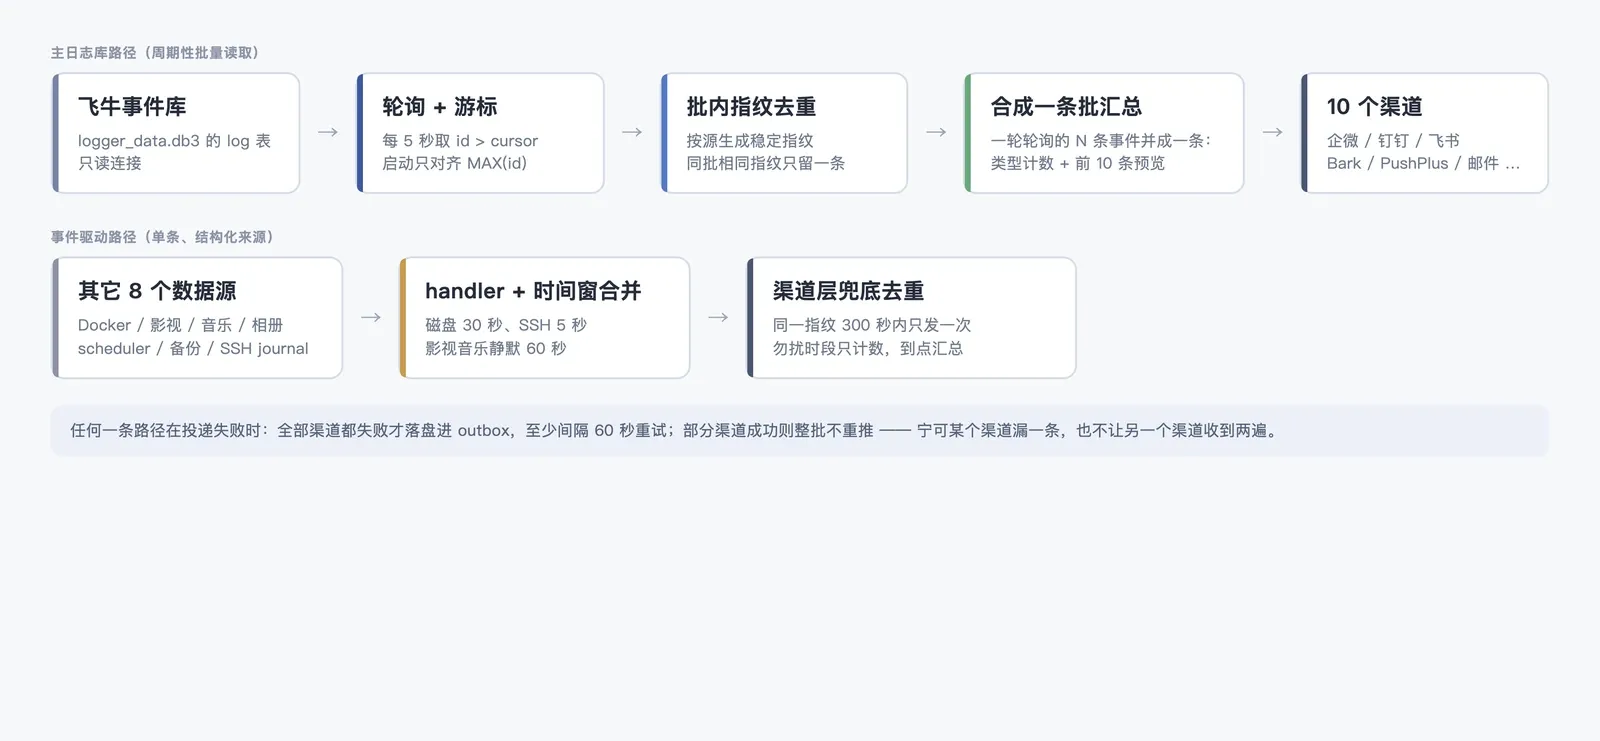
One event, from the write into the database to the buzz on your phone: four steps.
Most of what came after got added because something was annoying me:
- Dedupe window. The same event goes out once per 300 seconds. Otherwise one disk that keeps waking up can flatten your battery.
- Disk event merging. Repeated wake/sleep events of the same kind collapse into one message inside a time window.
- Do not disturb. Off by default from 22:00 to 07:00, then one “here’s what happened overnight” message when the window ends.
- Media and music digests. Library imports and scraping are naturally chatty, so the app waits for 60 seconds of silence and sends one “this is what got added” message.
- Poll-batch summary. The main log poller is more aggressive — everything it reads in one poll (5 seconds) goes out as a single message: counts by type plus the first 10 items. Sending them one by one runs into WeCom’s 20-per-minute limit, and the message the rate limiter drops is always the one that mattered.
- Persistent outbox. When a push can’t go out, the batch gets written to disk and retried after a restart instead of quietly vanishing.
- Config hot reload. Change a setting on the web page and it applies. No container restart.
Then came the two bits of actual engineering. First, a web config page (port 18080 by default on Docker; you pick the port in the installer for the FPK). It’s gated by a password on first visit: on Docker you set it with the init code printed to the startup log, the FPK sets it up in the install wizard, and the config file only ever stores a salt and a hash. Second, two install formats — a Docker image (x86 and arm) and an FPK package you can find in the fnOS App Center. NAS owners split into two camps: the ones who are happy in a compose file, and the ones who only want to click “Install”.
What it looks like now
Once it’s installed, roughly this:
- Someone logs in, fails a login, or logs out → pushed
- Disk found, woken, sleeping, I/O error → pushed
- Container started, stopped, crashed, update failed → pushed
- CPU pegged, temperature high → pushed
- UPS on battery, mains back → pushed (this one has actually saved me)
- Samba / WebDAV / FTP / NFS / SSH service turned on or off → pushed
- Media imported, scraping finished, music added → folded into one digest
What you need to run it
Not much:
| What | Notes |
|---|---|
| A fnOS host | Docker or the App Center, pick one |
| Read access to the log DB | Default path /usr/trim/var/eventlogger_service/logger_data.db3 |
| One push channel | A WeCom group bot is the least hassle. DingTalk, Feishu, Bark, PushPlus, MagicPush, SMTP email and a generic webhook all work too |
| Python 3.9+ if you want to hack on the source |
Two install routes below. Pick one.
Route A: Docker (if you’re comfortable with compose)
Pick any directory on the NAS, say /vol1/1000/docker/fn-message-bot, and write a .env:
UI_PORT=18080Then a docker-compose.yml:
services:
  fn-message-bot:
    image: sunanang/fn-message-bots:latest
    container_name: fn-message-bot
    restart: unless-stopped
    network_mode: host
    volumes:
      - ./data/logs:/app/data/logs:rw
      - ./data/cursor:/app/data/cursor:rw
      - ./config:/app/config:rw
      - /usr/trim/var/eventlogger_service:/usr/trim/var/eventlogger_service:ro
      - /var/log/journal:/var/log/journal:ro
      - /run/log/journal:/run/log/journal:ro
      - /etc/machine-id:/etc/machine-id:ro
      - /etc/os-release:/host/etc/os-release:ro
      - /var/lib/dpkg/status:/host/dpkg/status:ro
    environment:
      - TZ=Asia/Shanghai
      - UI_PORT=${UI_PORT:-18080}
A few lines are worth explaining:
hostnetwork mode, so the health check can see the NAS’s real NICs and IPs. The port comes fromUI_PORT; there’s noportsblock./usr/trim/var/eventlogger_servicehas to be mounted read-only, and don’t change the path.- Don’t skip
TZ. The image defaults to Asia/Shanghai, but if the container ends up onUTCyour do-not-disturb window shifts by eight hours.
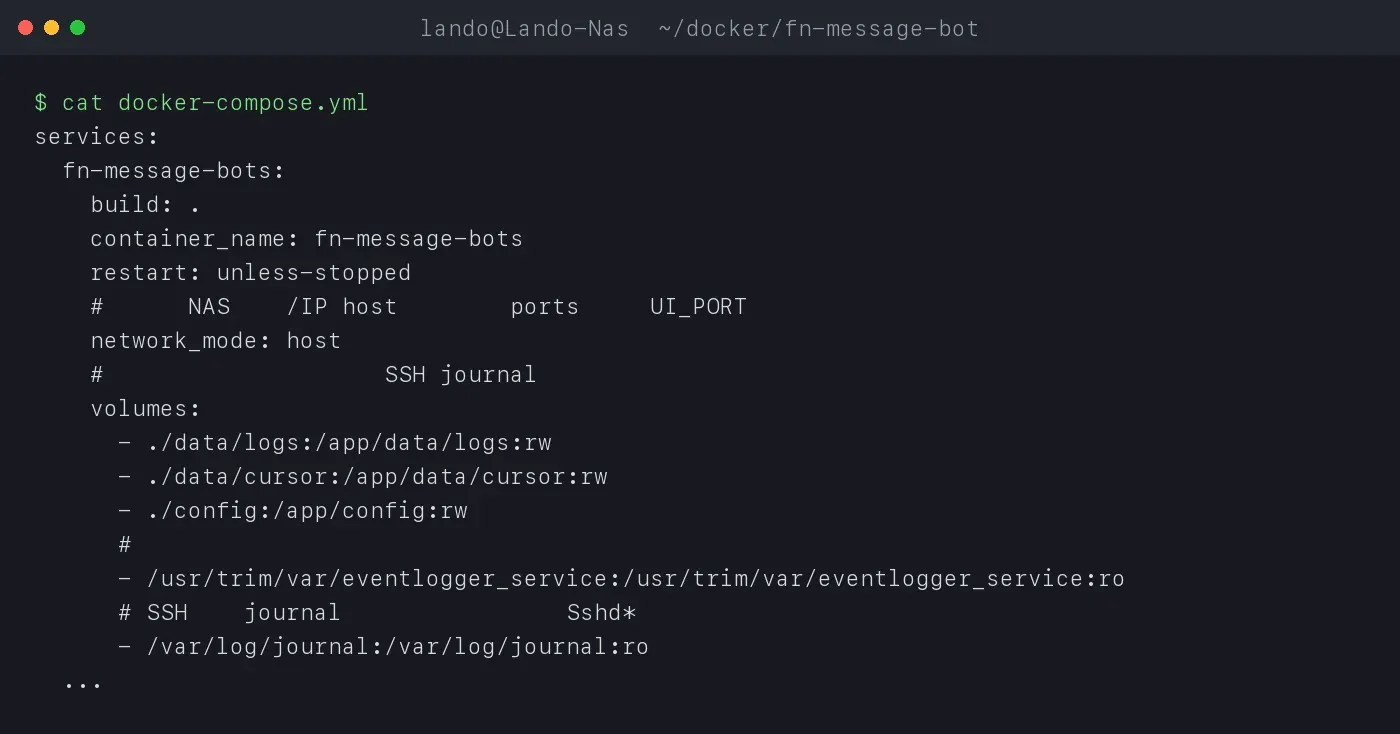
Then:
docker compose up -d
docker logs -f fn-message-bot
The log prints an init code. Copy it, you’ll need it in a minute.
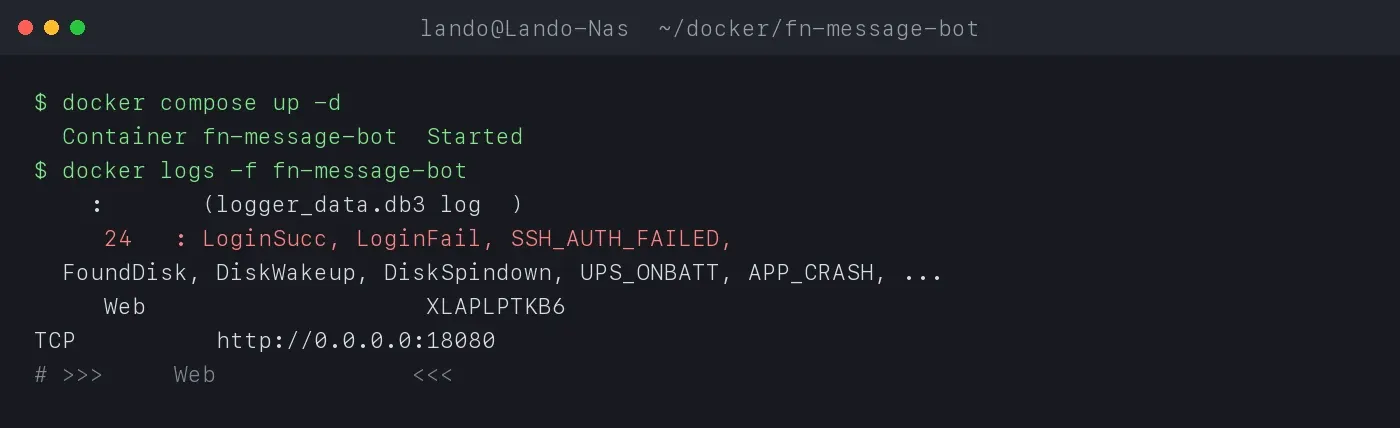
Route B: FPK install (if you’d rather not touch a terminal)
Open the fnOS App Center and search for 日志推送 (“log push” — that’s the listing name, not “FnMessageBots”) and install it. Or grab the .fpk from GitHub Releases and install it by hand.
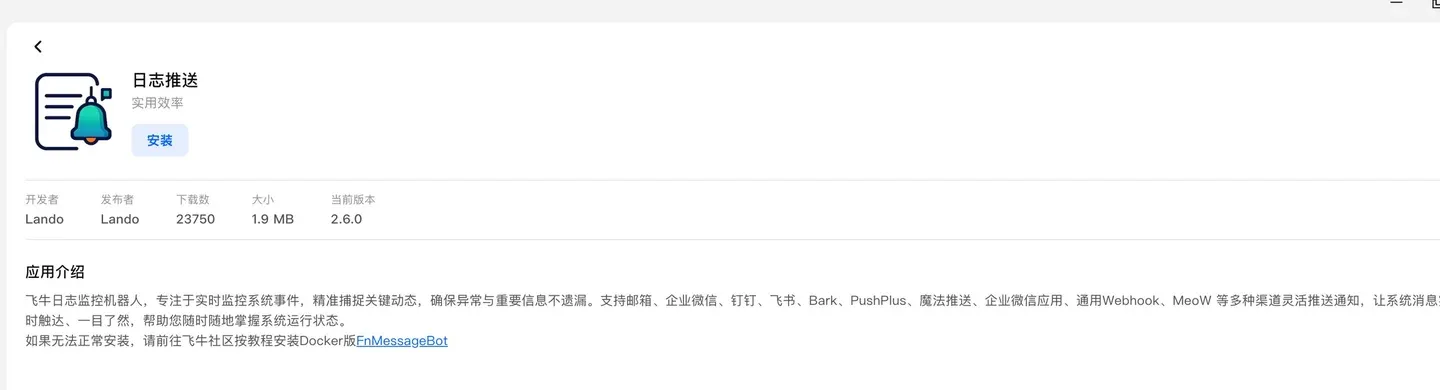
The detail page looks like this. Hit “Install”. This one is a screenshot from 2.6.0, back when downloads were around twenty thousand; it’s past 70k now.
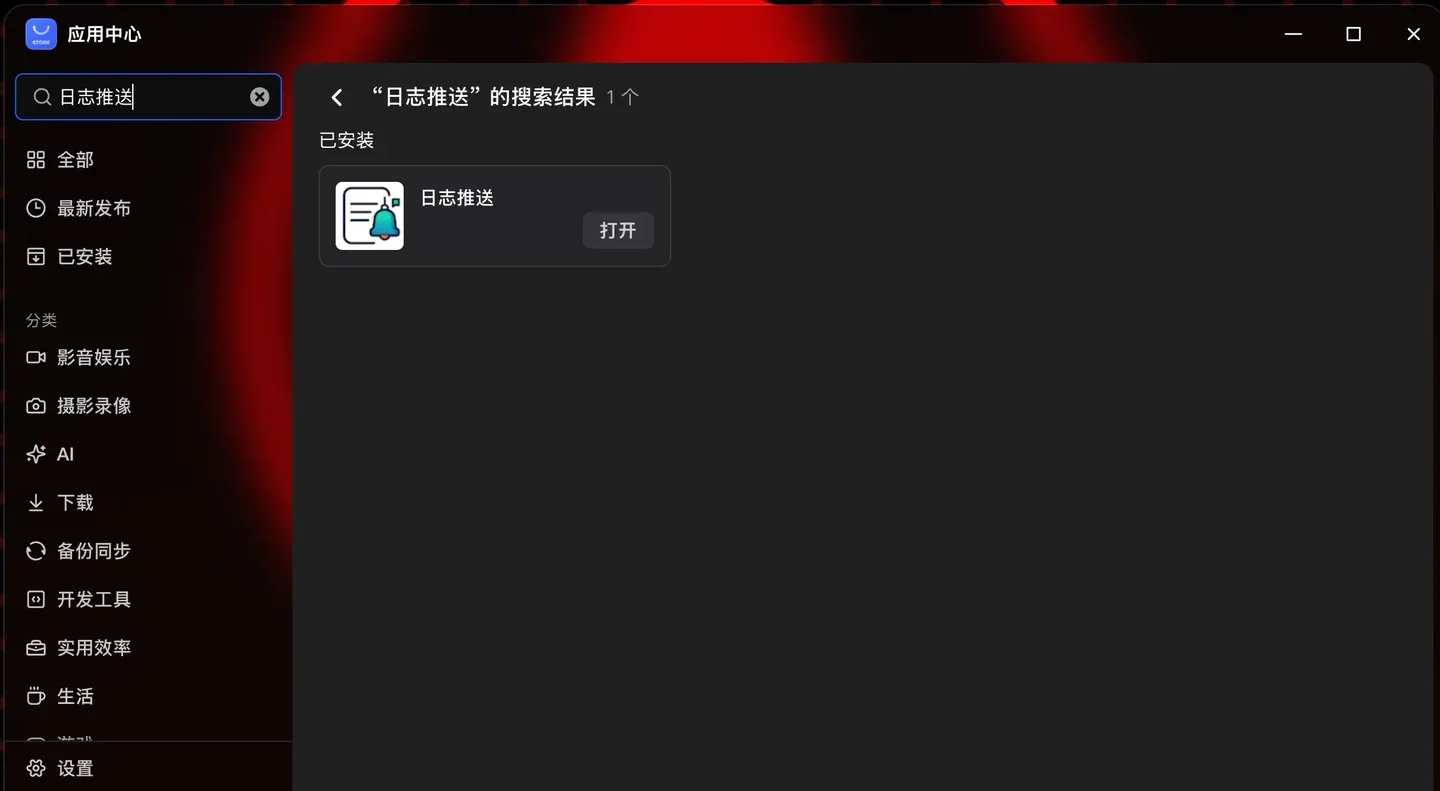
Search, and there’s exactly one result.
There are two packages that look alike but aren’t:
- Regular build (
FnMessageBot-x.y.z.fpk): runs as the app accountFnMessageBot, minimum privileges. Recommended. - root build (
-root.fpk): the whole app runs as root, and the name gets “(root)” appended. Only use it when you genuinely can’t read some data source otherwise.
Both share the same app ID and version, so you can only have one installed — it’s an overwrite, not a coexistence. If you switch from the root build back to the regular one, the data files root left behind may need an ownership fix; the installer tells you what to run.
The wizard is a single page: a listen port (prefilled with 18230, change it if you like) and an access password. There’s no “pick a run-as account” step — the package you installed already decided that. When it’s done, open it from the App Center.
Configuration: three steps, no more
Step one: get past the password
The two routes start differently, so don’t mix them up:
- Installed as an FPK: the password was set in the wizard. Open the config page, type it, done. No init code involved.
- Installed with Docker: the first visit asks for an init code — the one in
docker logs, or the fileconfig/.setup_codeinside the container. The point is to stop someone else on the same LAN from setting your password first. The code is void once a password exists.
You can also preset a password with the FNMB_WEB_PASSWORD environment variable at deploy time (8 characters minimum) and skip this step entirely.
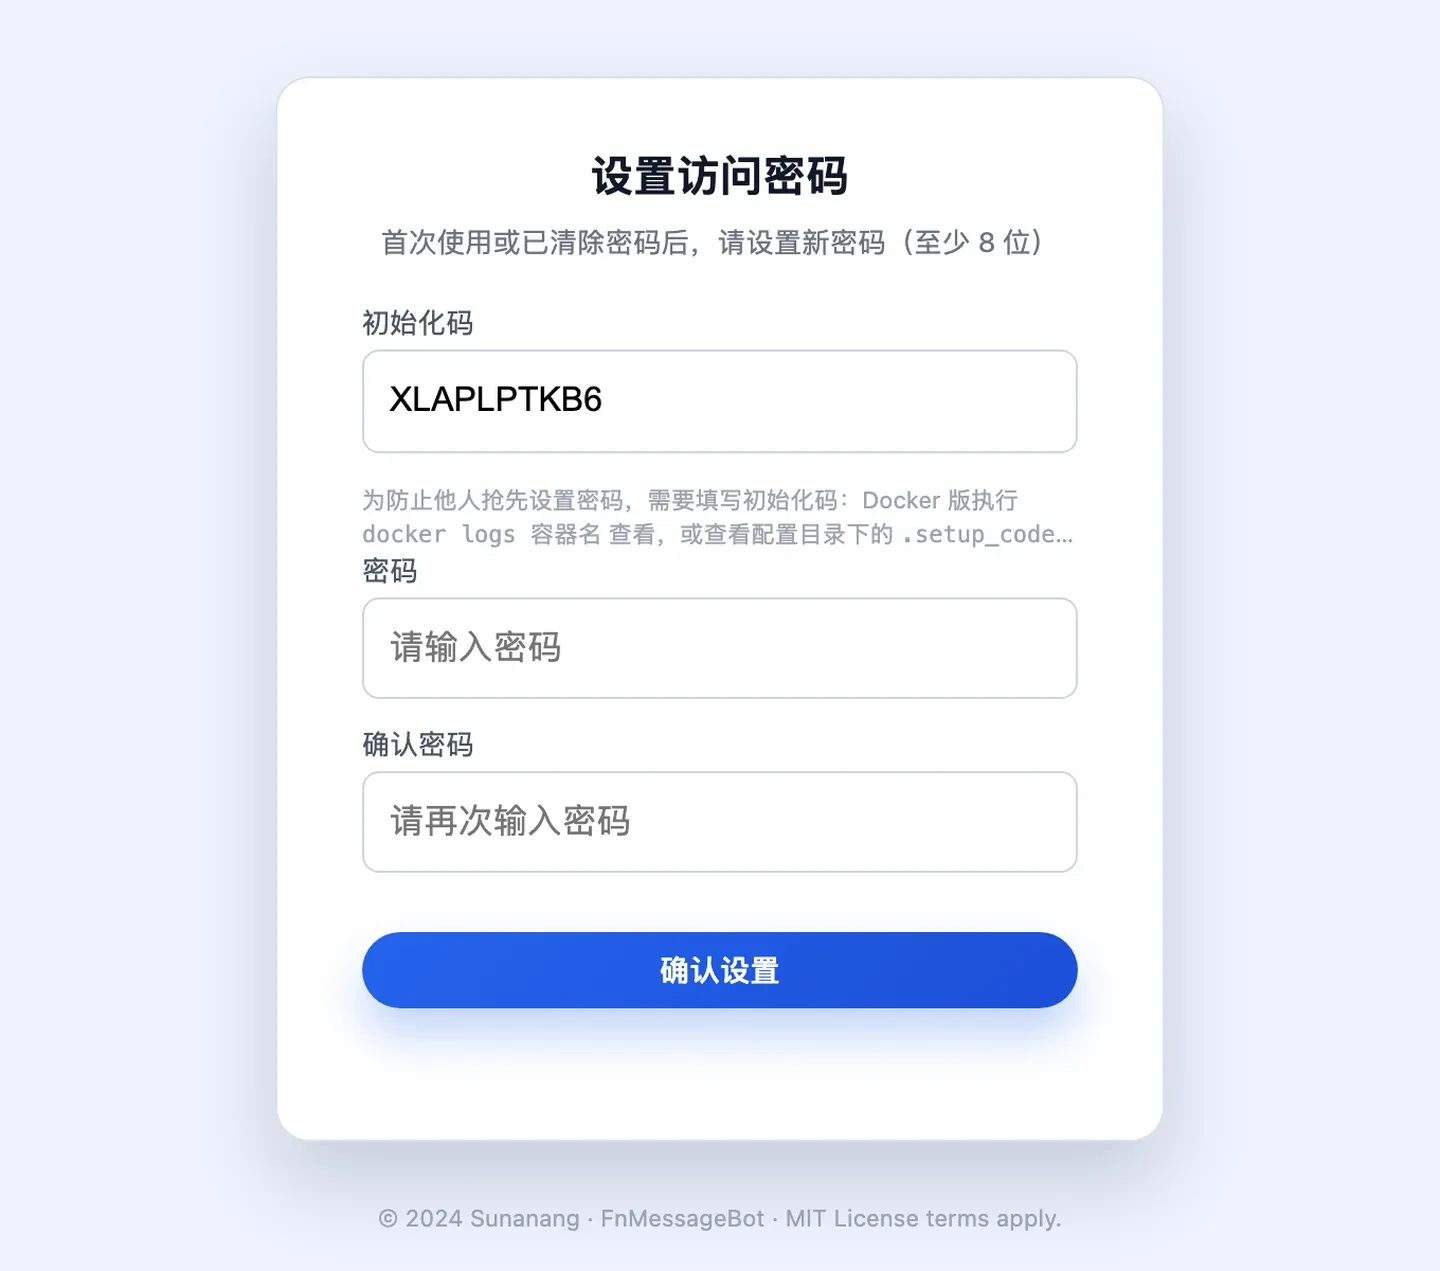
This is what a Docker install looks like: the right init code, then you can set a password. FPK installs never see this screen.
Step two: tick the events
The first thing to do on the config page is not fill in a webhook. It’s turn off the events you don’t care about.
Sounds odd, but it’s practical: tick everything and day one is fun, day three you’re annoyed, and by day five you ignore the whole bot out of habit. At that point you may as well have not installed it.
What I run: login and login failures, disks, container crashes, UPS — all on. CPU alerts only when it stays high. High-frequency stuff like file deletions, off.
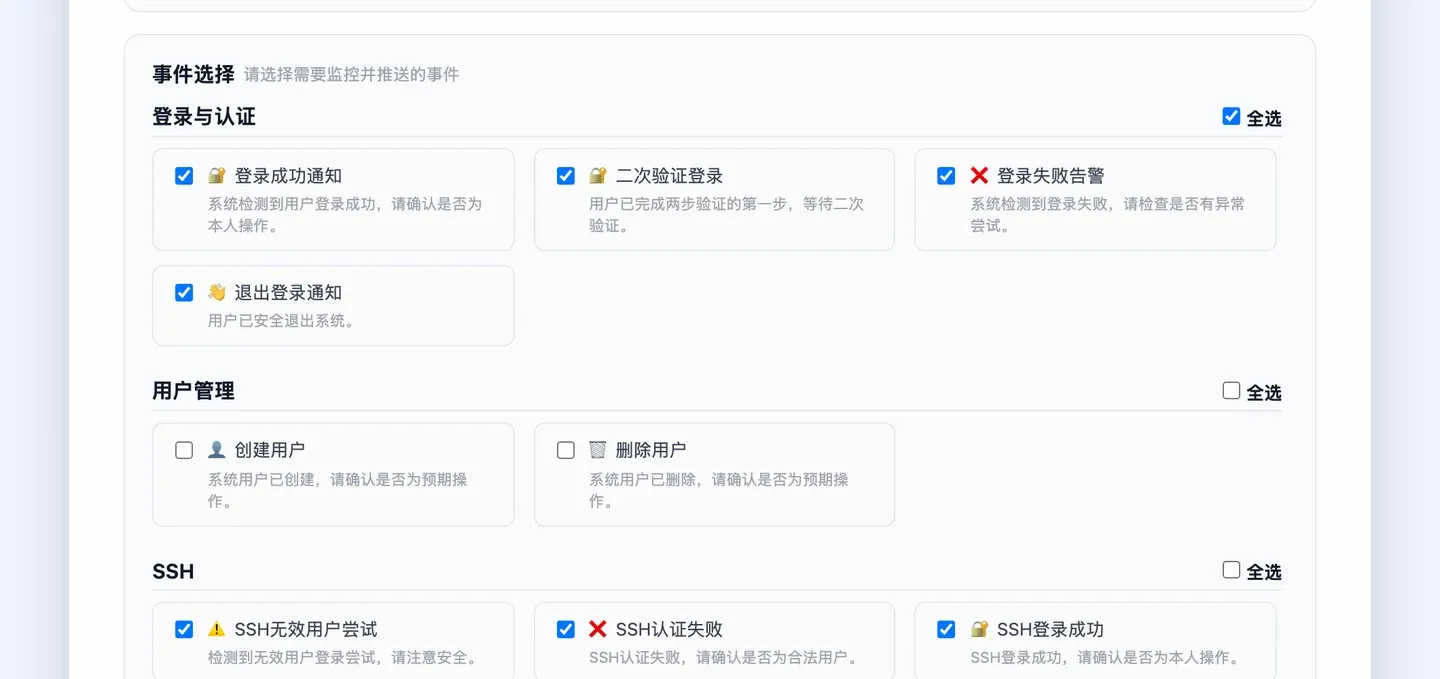
Every event has a plain-English line under it, so you can decide without opening the docs.
Step three: add a push channel
Take a WeCom group bot as the example: add a bot to the group, copy its webhook, paste it into the matching field on the config page, save.
Saving is a hot reload. No container restart, it takes effect within seconds.
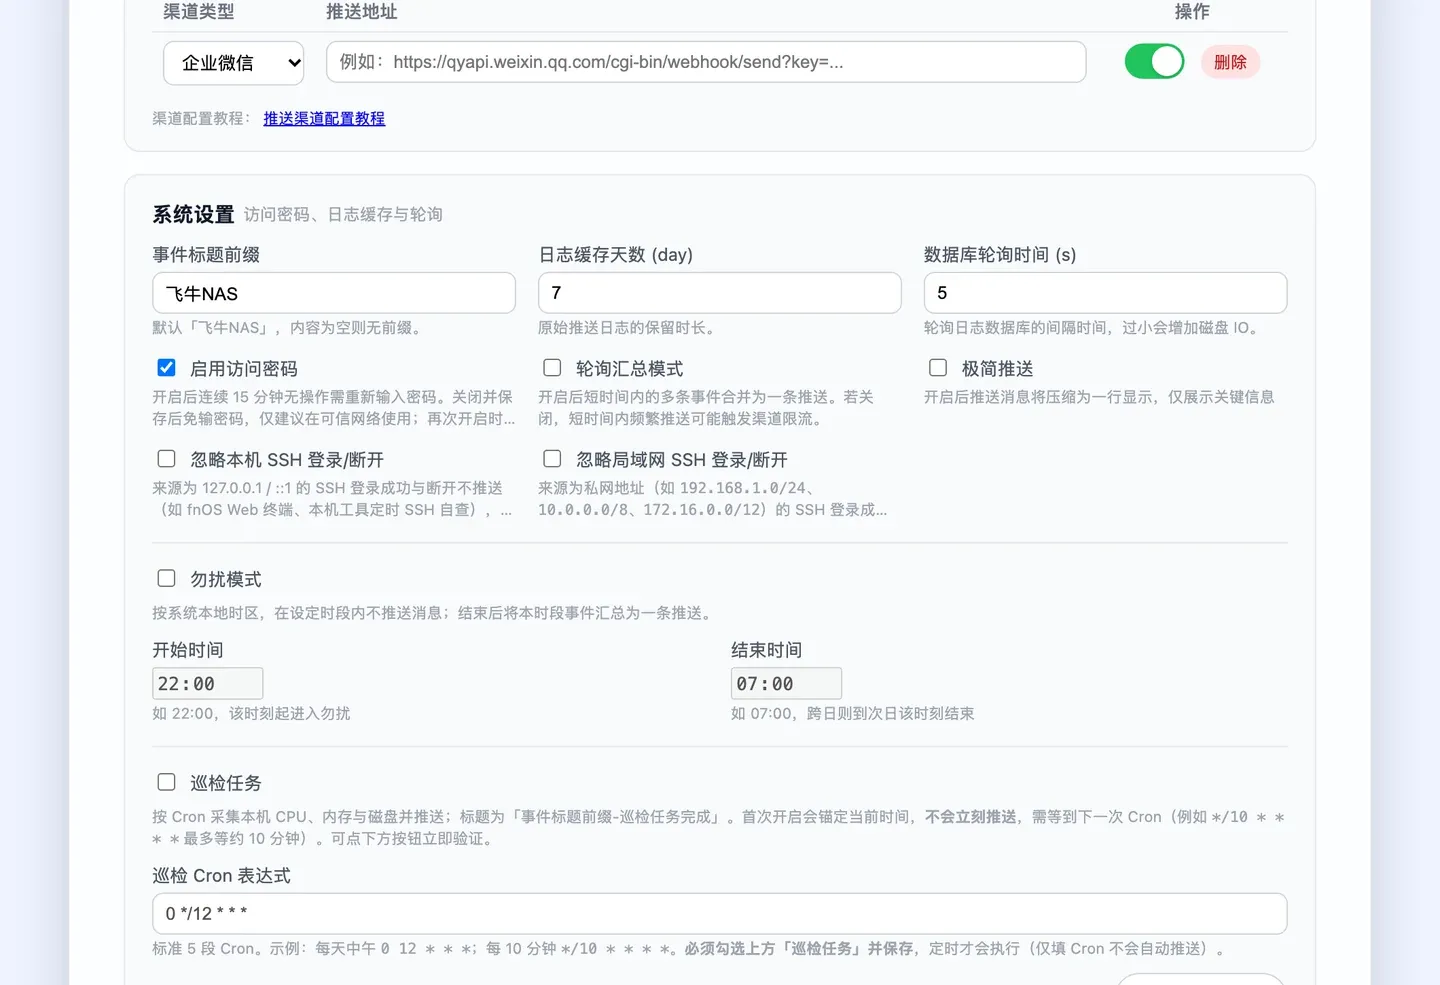
Channels are the top row. Below that, system settings — title prefix, poll interval, access password, do-not-disturb window, patrol cron.
The page in full: event groups on the left, push and quiet hours on the right.
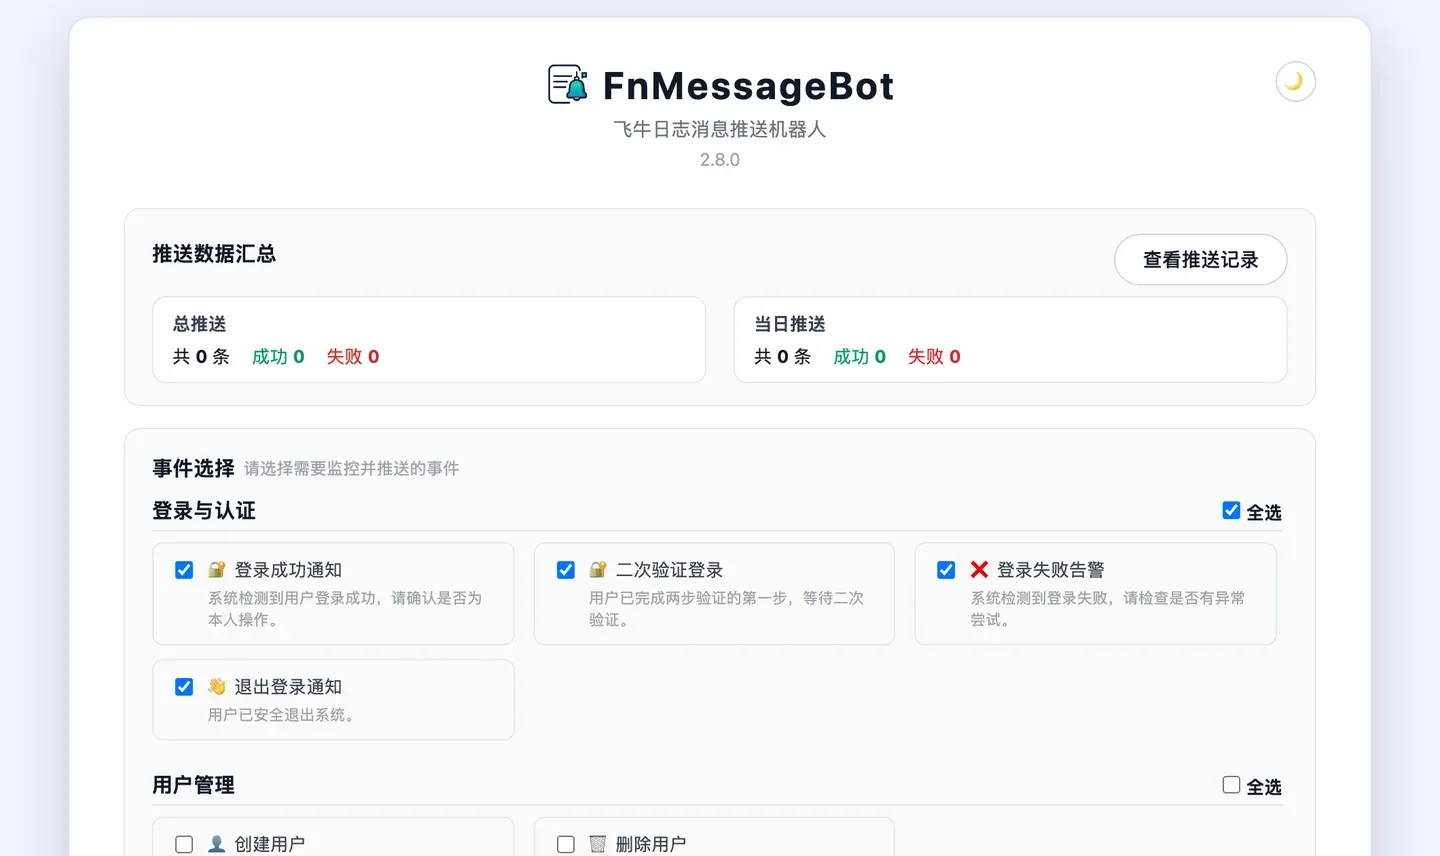
This is what opens: push statistics up top, every monitorable event listed by group below.
If you plan to put the config page on the public internet set
FNMB_TRUSTED_PROXIESto the proxy’s IP/CIDR — only the ones you control — and make sure the proxy actually forwardsX-Forwarded-For. Don’t take the shortcut and put0.0.0.0/0in there; that rips the origin check out completely.
Day to day
Once it’s set up you don’t need to touch it daily. It just runs. The three moments it earns its keep:
When a message arrives. Phone buzzes, you look at what happened:
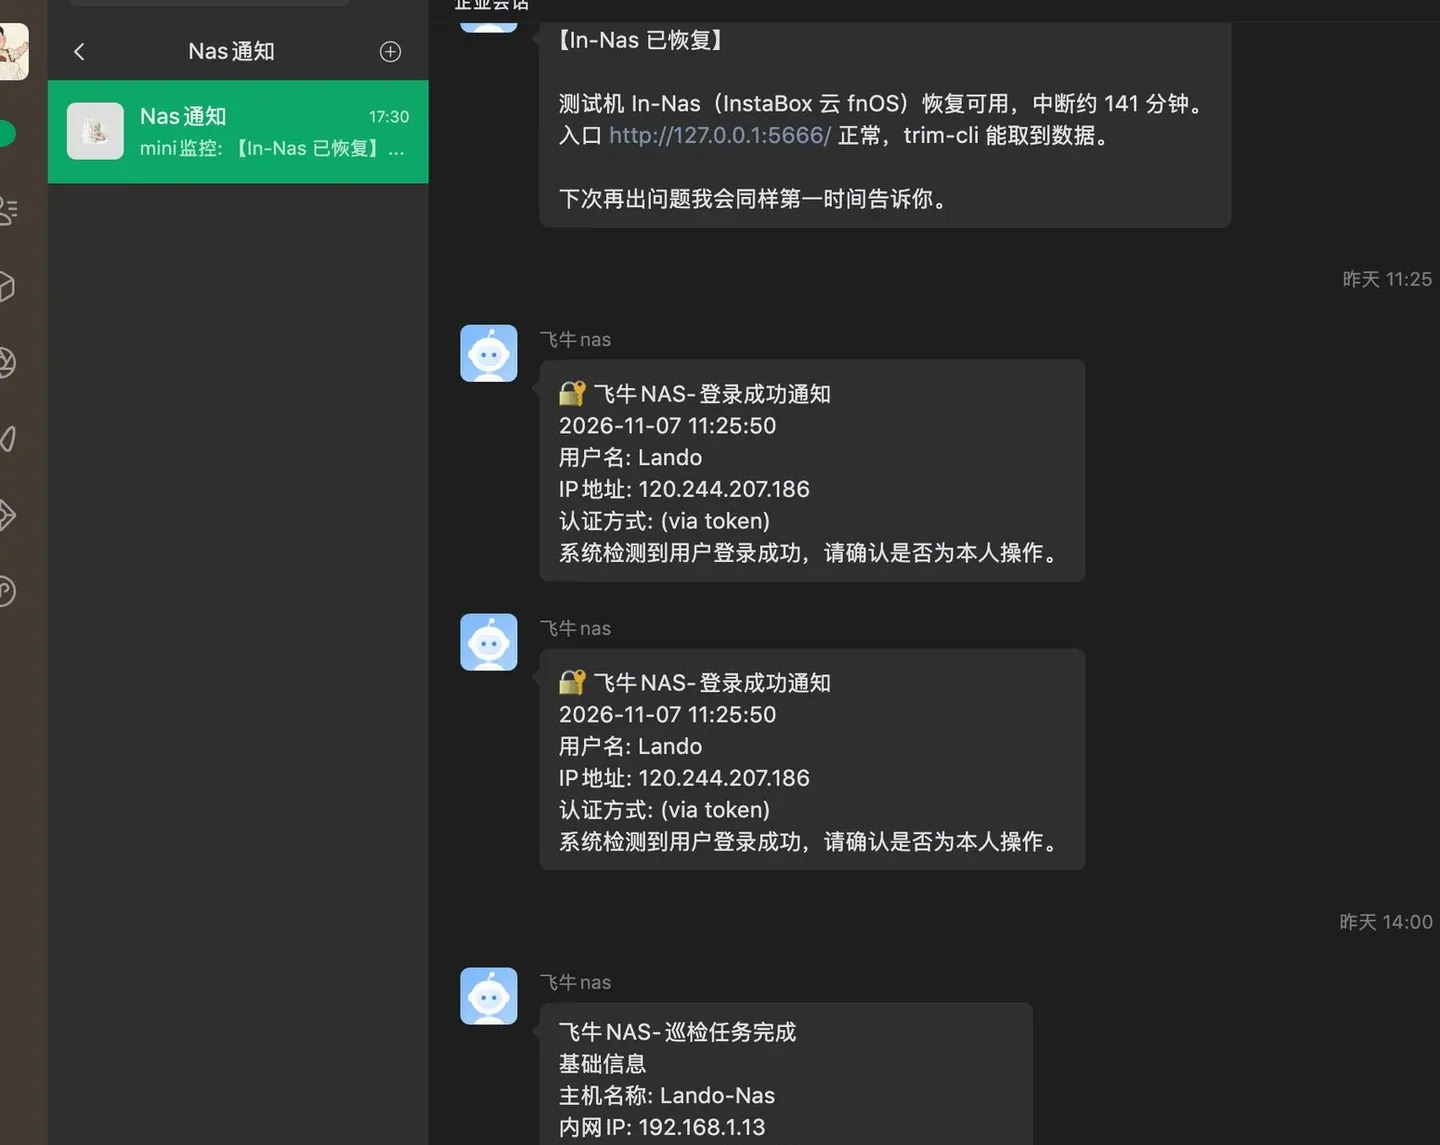
What it looks like on my phone: login notices, patrol reports, service-recovery reminders, all in one conversation.
When you want to know what happened over the last few days. The raw records are in the database, and there are a couple of small tools for reading them:
python tools/log_manager.py stats
python tools/log_manager.py recent --hours 24
python tools/log_manager.py type LoginFail --limit 10
When you want quiet. Set the do-not-disturb window and it banks everything, then hands you one digest in the morning. Media imports — the “twenty episodes landed at once” kind — get folded into a single message too, so no wall of notifications.
How to prove it actually works
Don’t skip this. Install it and leave it unverified and you don’t know whether it’s running at all.
Fastest way: make an event on purpose.
For instance, from another machine, SSH into the NAS with a bad password:
ssh wronguser@192.168.1.13If you’ve got SSH_AUTH_FAILED ticked, the phone should buzz within seconds. Phone buzzes, the whole path works.
If it doesn’t buzz, check three places, in this order:
- Is the container alive?
docker ps, ordocker inspect --format '{{.State.Health.Status}}' fn-message-bot. - What is the app saying?
data/logs/monitor_YYYYMMDD.log— did it pick the event up, what did the push endpoint return? - What did the config page say when you saved? If a data source is under-privileged, the page tells you why right under the save button, plus a copy-paste command to fix it.
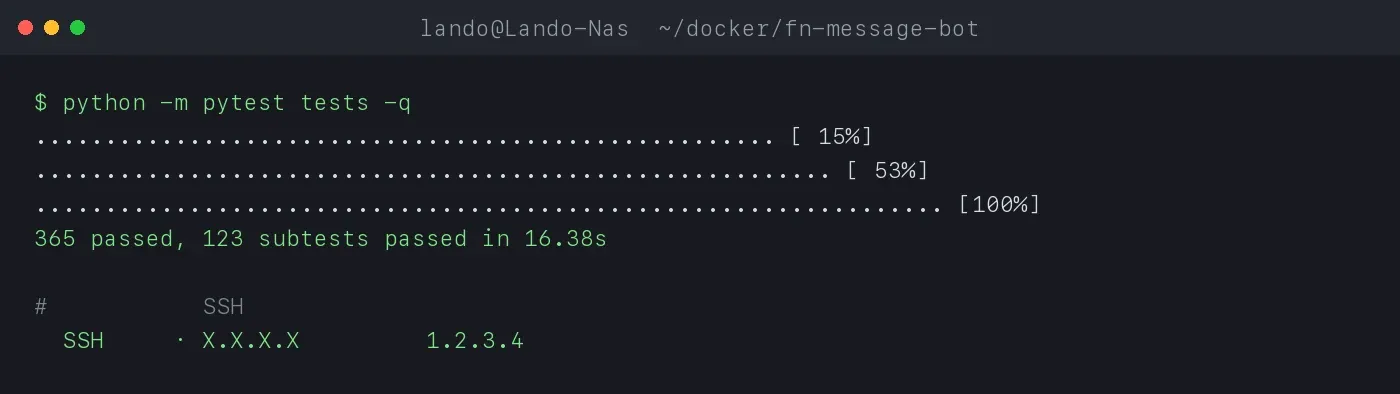
Want to go further? The repo ships a test suite, no real NAS needed:
python -m pytest testsIt covers ingestion, permission diagnostics, the config API, and the FPK install/upgrade/permission script lifecycle.
Traps I hit that you’ll probably hit too
Not enough permissions. The most common one by far. The app won’t escalate for you, and it won’t fall over because one data source is unreadable — it tells you on the config page what’s missing and how to grant it. On the regular FPK build the commands target the FnMessageBot account; on Docker it points you at your mounts and container UID/GID.
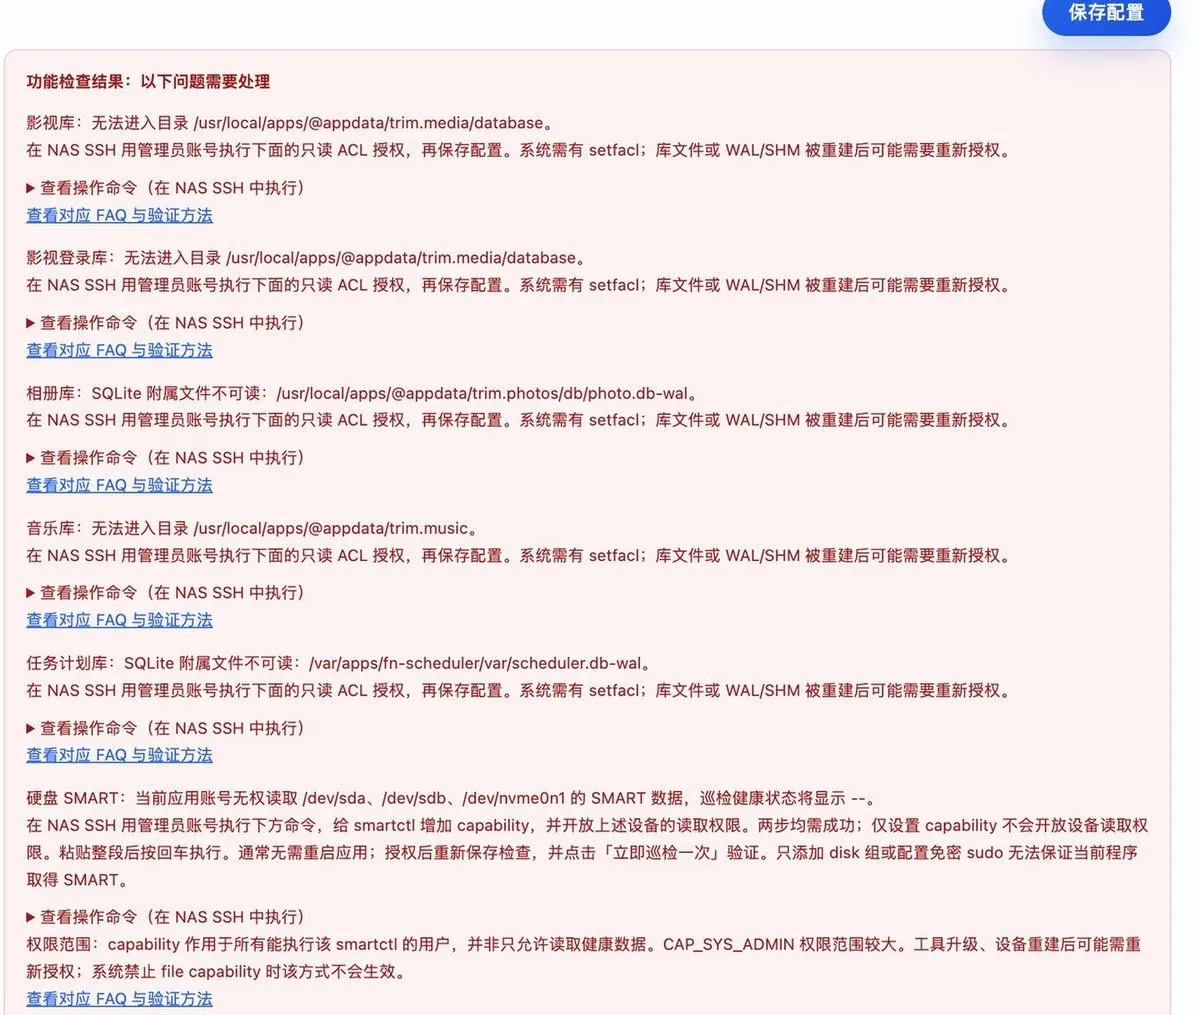
When you save, it checks each data source and writes out exactly which permission is missing and what command to run.
Wrong time. If every push is off by a few hours, it’s almost always TZ. Changing an env var on a container needs a recreate, not a restart.
Offsets baked into the stored timestamps. Times are treated as standard Unix timestamps by default, and since 2.8.0 there’s no extra 8 hours added. Only use LOGTIME_DISPLAY_OFFSET_SECONDS when an old system genuinely stores skewed times — 28800 means add +8 hours. And if you upgraded from an old version and your log times came out 8 hours early, an old config is still sitting there; delete it or set it to 0. This is a display correction only, don’t try to use it to fix your do-not-disturb timezone.
Don’t mount docker.sock casually. Mounting it hands the container root-equivalent control of the host. Only turn it on if you really need container events, and know what you’re trading.
SSH events don’t show up. Newer fnOS builds often have no Sshd* records in the main log DB, so you need /var/log/journal, /run/log/journal and /etc/machine-id mounted. The docker-compose.yml in the repo has them; the trimmed-down example in the README doesn’t, and copying that one will leave a hole.
Wrapping up
There’s no grand ambition here. It solves one small irritation: I have a machine that never stops working, and I was finding out whether it broke by luck.
Where it stands GitHub: 85 stars. App Center plus Docker: 70k+ downloads. Stable users estimated at around a thousand. Those aren’t big numbers, but this thing is installed on other people’s NAS boxes and running every day — that matters more to me than stars, because it means when I get a push wrong, someone else’s phone rings.
If you run fnOS, give it a try. And do the verification step — make an event, watch the phone buzz, and then you’ll actually believe it.
- How to configure all ten push channels: Configuring the ten push channels
- Project page (architecture and tradeoffs): FnMessageBots
- Source (MIT): github.com/Sunanang/FNMessageBots
- Docker image:
sunanang/fn-message-bots:latest - FPK: search
日志推送in the fnOS App Center, or grab it from GitHub Releases